

A look within: mapping the distribution of proteins in teeth
Over the last decade the use of proteins as the focus of archaeological research has become much more popular. With the increased usage there has also been an increase in the diversity of research questions that can be addressed with ancient proteins as well as the methods used to analyse them.
Preservation of proteins
Palaeoproteomics, the study of ancient proteins, has gone from simply the species identification of bones to investigating evolutionary relationships between extinct species, the health of past populations and culinary traditions.
However, no method is without its limitations and palaeoproteomics is no exception. Like many other biomolecular methods its main constraint is the preservation of proteins. There have been some studies on protein preservation and differences in preservation between different bone types, but we know very little about what is happening inside the object. Do all proteins decay at a similar rate or are some better protected? Does it matter if the protein is close to the centre or the outside of the object?
Answering these questions will enable us to more precisely target specific areas for sampling. Hopefully targeting protein intense regions might lead to a reduction in the amount of material required for analysis. Additionally, investigating the location of particular proteins inside biological tissue may tell us something about the health of these individuals.
Setting up the experiment
To see if we could visualise the distribution of proteins in teeth we decided to use a technique called Mass spectrometry imaging (MSI) on a collection of (post-)medieval teeth from Arnhem. We choose teeth as our samples, because teeth (along with bone) is the type of material most commonly studied with palaeoproteomics. The composition of the dentine of teeth is also very similar to bone, making them relatively easy to compare. Additionally, in contrast to bone teeth grow incrementally and they do not seem to remodel much. Consequently, the protein composition within the tooth should be fixed for life at the time of formation. As a result, the spatial distribution of proteins in a tooth might be able to give us information about how life history events might impact tooth development.
Mass spectrometry imaging
Mass spectrometry is the method of choice in palaeoproteomics and MSI is a particular form of this method that combines mass spectrometric with spatial data. In mass spectrometry proteins are chemically extracted from the sample and fragmented with an enzyme (‘digested’) into parts called peptides (Fig. 1). Enzymes only cut the protein at particular places so knowing the structure of the complete protein we can predict the masses of the peptides. Particular peptides can be diagnostic for their parent protein or even the species the protein belongs to. Mass spectrometry allows us to measure the mass of these peptides, which we can then compare with a database of known peptides, thus enabling us to identify the proteins our observed peptides come from.
In ‘normal’ mass spectrometry we analyse a sample from an object, but in MSI a thin-section of the object is made. A very fine grid is then laid over the sample, in our study each grid cell was 13 by 13 μm, and we measure a mass spectrum per each grid cell. Then we can create a heatmap of the intensity of a selected protein over the sample, which will show in which areas the protein is more present.
Mapping collagen
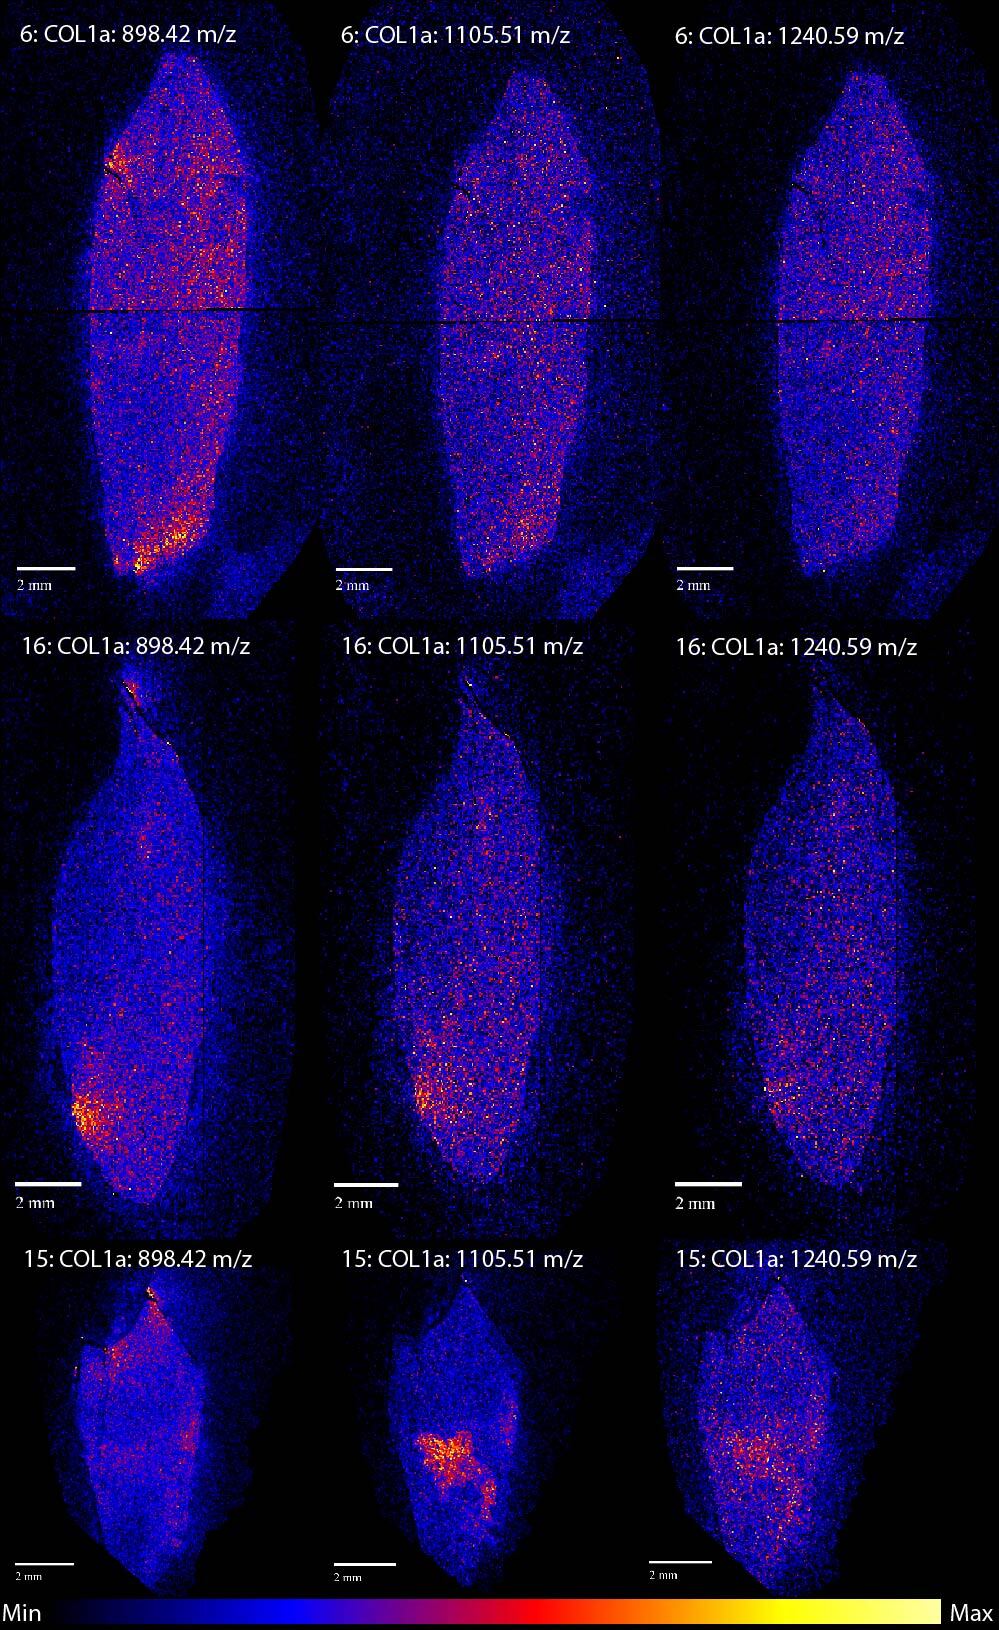
A good example of a MSI image is figure 2. For this image we chose to visualise three different peptides, denoted by their masses, of collagen alpha-1 (I). Collagen is the most abundant protein in teeth and bone and is the most commonly analysed protein in palaeoproteomics. In protein research collagen is usually analysed in order to determine to what species the sample belongs, but collagen also plays an important role in stable isotope research. In stable isotope analysis the proportion of 13C to 12C and 15N to 14N is used to investigate the diet of the organism the sample is from and collagen is frequently used as a source for these isotopes. Learning where the collagen intensity is highest would therefore be very interesting for both these kinds of analysis.
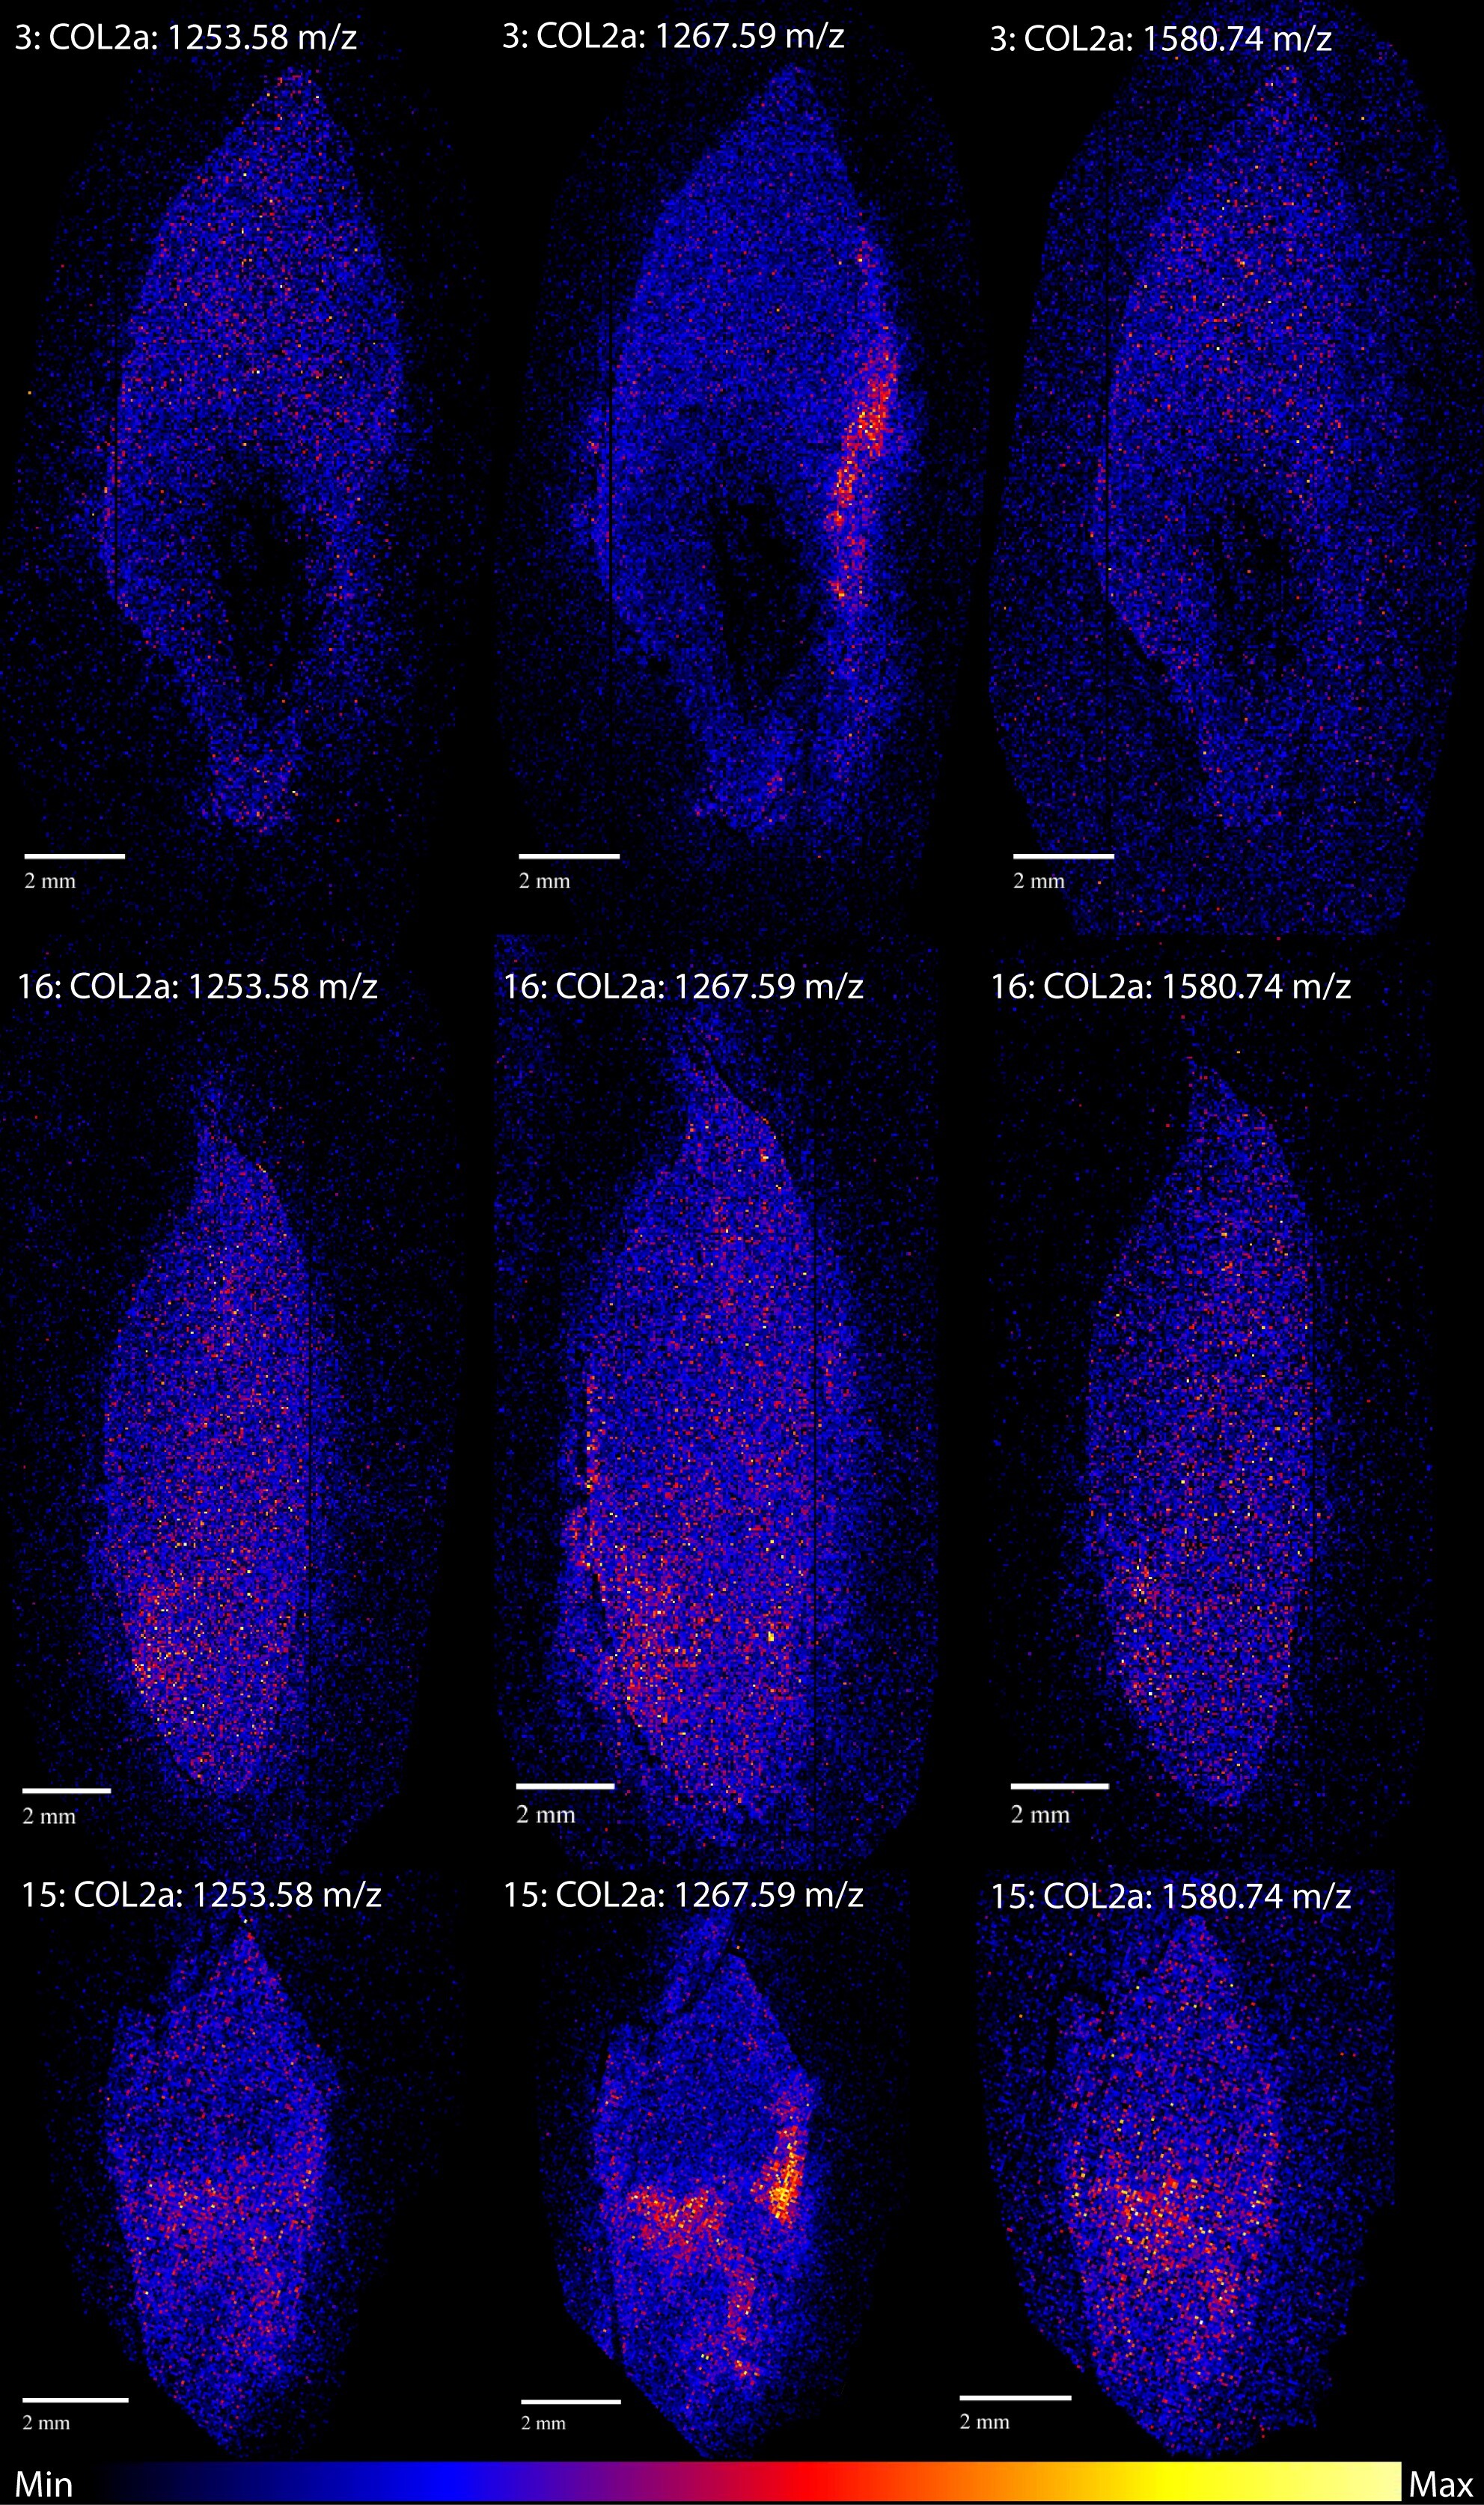
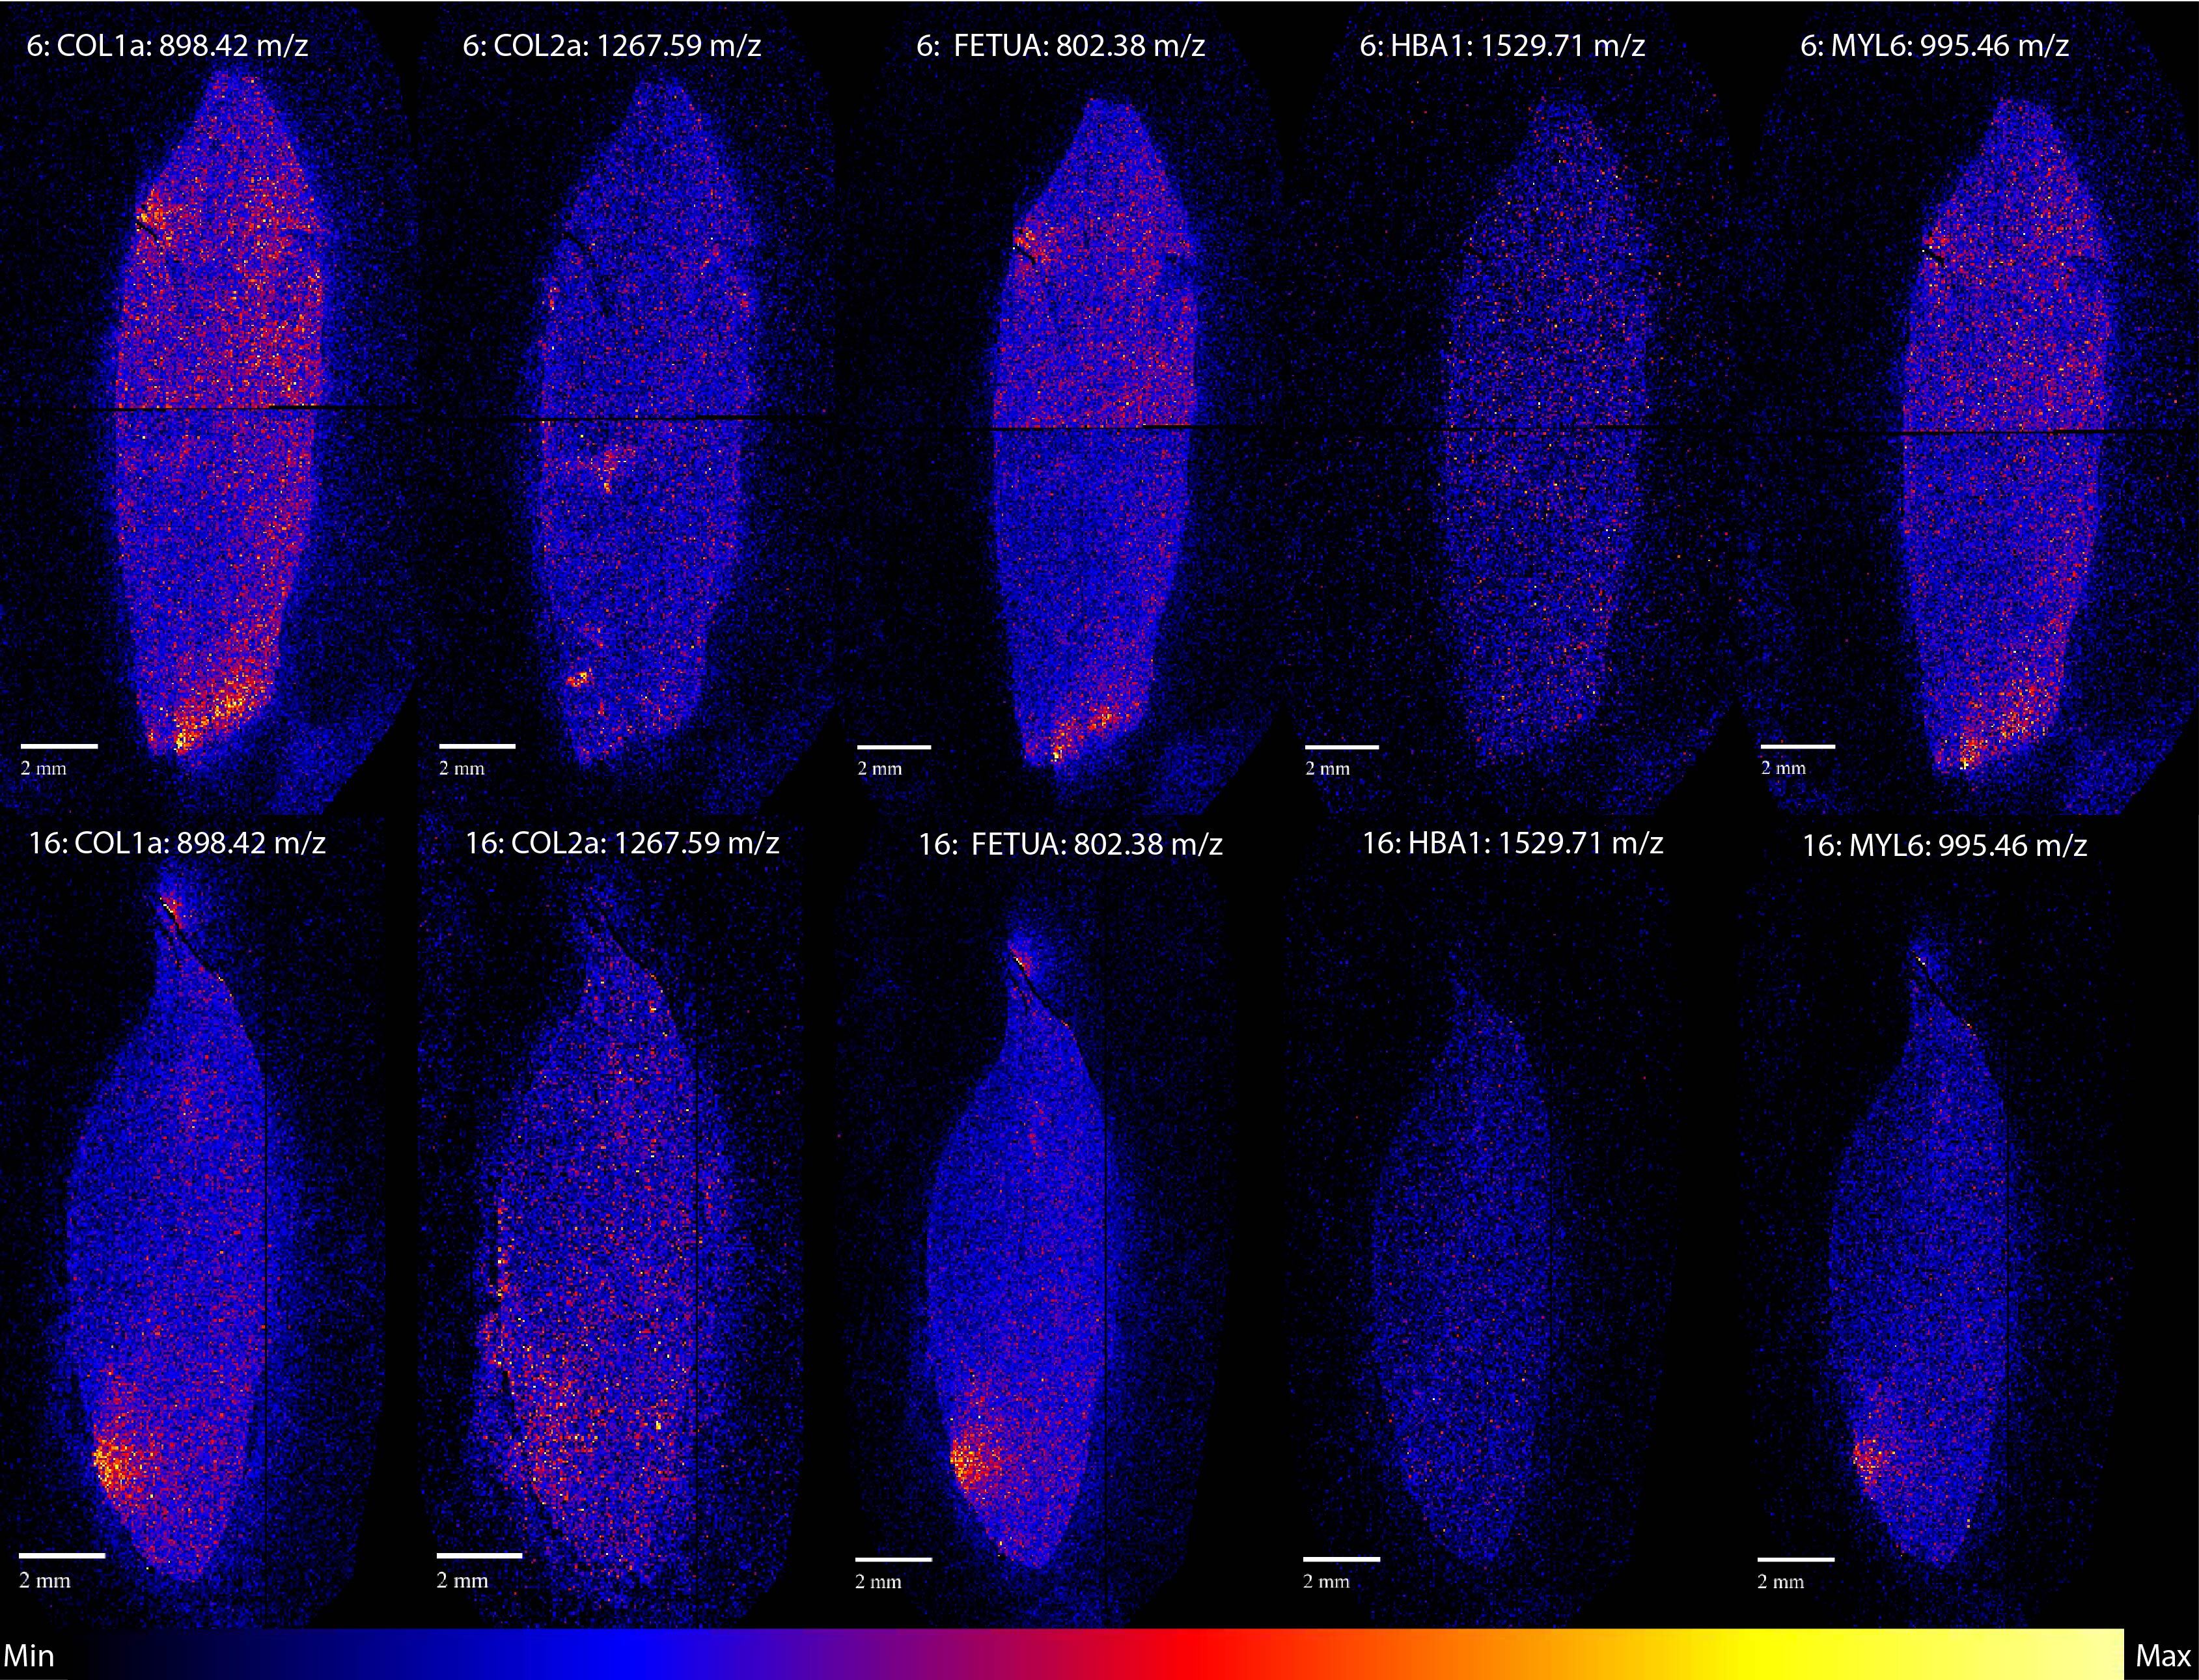
Figure 2 shows a few bright spots, which signal a high intensity of collagen, in all three teeth. These bright spots seem to occur at the edges of the teeth and are usually at the same location for the different peptides within the same tooth. Sample 15 is the odd one here, as the 1105.51 m/z peptide seems to have a different distribution compared to the other two. Considering that the different peptides are fragments of the same protein we would expect them to show very similar spatial patterns. However, this is not the only example of one peptide standing out. Figure 3 shows the distribution of collagen alpha-2 (I), a different type of collagen. For this protein the peptide at 1267.59 m/z seems to have a different distribution compared to the other collagen alpha-2 (I) peptides for all samples.
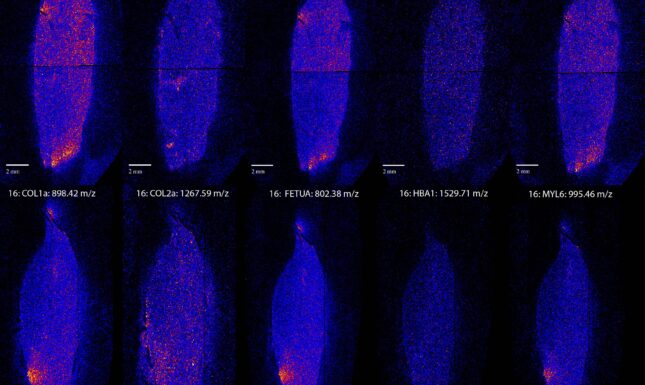
Apart from the 1267.59 m/z collagen alpha-2 (I) peptide, most of the others show similar distributions. Of the five proteins we analysed three, collagen alpha-1 (I), FETUA (another common bone protein) and the muscle protein MYL6, show very similar spatial patterns. HBA1, a blood protein, shows a different more homogenous distribution. We had expected HBA1 to differ from the others, but we thought it might be more focused around the pulp cavity, where the blood vessels run during life.
MSI, a new chapter in palaeoproteomics?
To summarise the findings of our research, we have successfully shown that mass spectrometry imaging can be used to visualise the distribution of proteins in archaeological teeth. In general it appears that protein intensity is concentrated in a few hotspots, often located near the edge of the tooth, and that for most proteins in a tooth these hotspots are at the same location.
There are a few exceptions, HBA1 has a different distribution from the other proteins, but since HBA1 is associated with different tissues compared to the other proteins, this is not very surprising. The case of the collagen alpha-2 (I) peptide at 1267.59 m/z is more difficult to explain. This might be a typical case where more research is needed to explain why this particular peptide is distributed so differently from the others.
But further research is precisely what this study has enabled. It was a pilot study to test if a promising technique like mass spectrometry imaging could work for archaeological material and indeed it does! Now it is time to start making sense of the spatial patterns we observe. Can we indeed link protein distribution to tooth growth models and thus use them to investigate childhood health and diet? Or can we target the protein intensity hotspots and will they indeed yield high quality data either for proteomic, isotopic or other types of analysis? The opportunities are endless and only time will tell what mass spectrometry imaging will add to our understanding of the past.
More information
Read the full article online at the website of Rapid Communications in Mass Spectrometry.

0 Comments